 Ломоносов
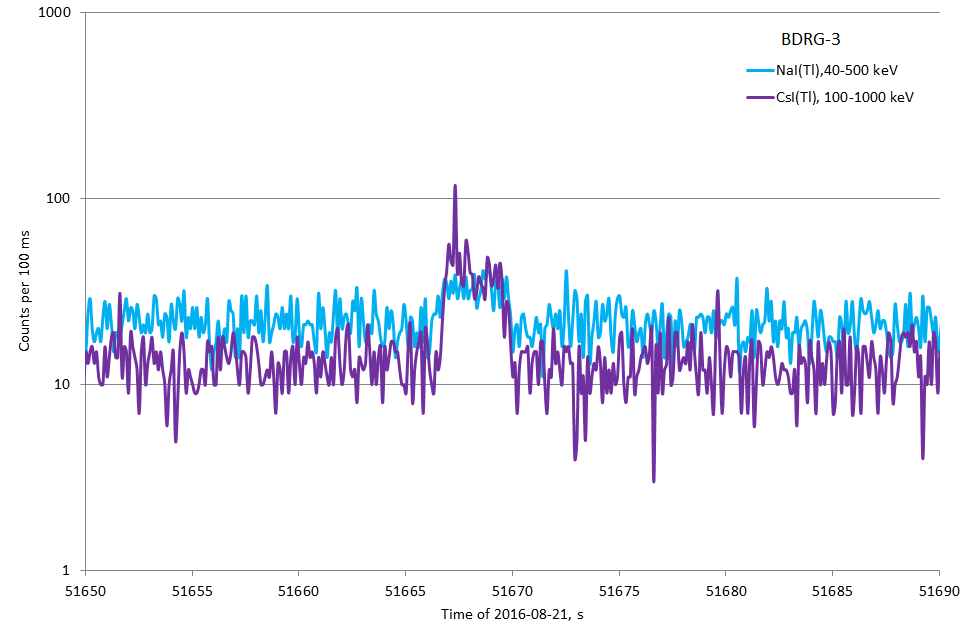
GRB was observed on 16/08/24, 14:21:07.00 UT
GRB was observed on 16/08/24, 14:21:07.00 UT. It was visible by all 3 detectors of BDRG in energy range up to 1 MeV. The parameters of GRB are
Total duration ~3s
Peak intensity in the range 20-1000 keV >6 photons/cm2*s
Peak intensity in the range 250-1000 keV >2 photons/cm2*s
TITLE: MVL-300 NOTICE
NOTICE_DATE: frd 26 Aug 16 20:30:00 UT
NOTICE_TYPE: MVL-300 Burst notice
GRB_DATE: 17624 TJD; 237 DOY; 16/08/24
GRB_TIME: 51667.00 SOD {14:21:07.00} UT
E_RANGE: 20 — 1000 [keV]
LC_URL: http://lomonosov.sinp.msu.ru/1093
COMMENTS: one peak GRB, total duration 3s
COMMENTS: Peak intensity >6 photons/cm2*s in the range 20-1000 keV
COMMENTS: Peak intensity >2 photons/cm2*s in the range 250-1000 keV
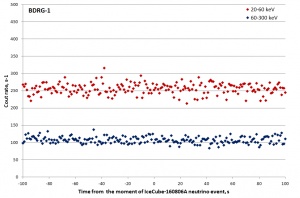
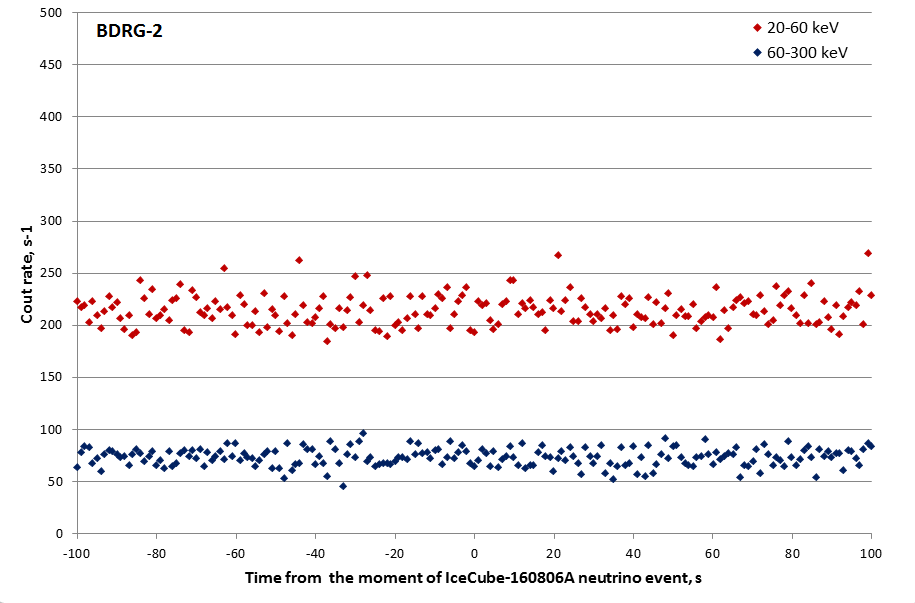
Observation at the IceCube event 2016-08-06 12:21:33
No significant gamma-ray flash was detected by BDRG/Lomonosov at the moment of IceCube event 20160806, 12:21:33
IceCube source was in FOV of BDRG 47 deg from the axis of the most illuminated detector
Upper limits (3 sigma) for a burst with 1 s duration are <0.23 cm-2 s-1 for 20-60 keV and <0.13 cm-2 s-1 for 60-300 keV
БДРГ нашел очередной гамма-всплеск
First SGRs and GRBs detected by BDRG/Lomonosov.
1. ”Lomonosov” space mission
Russian space mission «Lomonosov» (http://lomonosov.sinp.msu.ru) was launched 28.04.2016 from “Vostochny” to polar solar-synchronous orbit with altitude ~490 km. Scientific program of “Lomonosov” includes a multi-wavelength GRB study at different time scales. In particular the complex study of prompt emission will be provided based on the direct recording of readings of wide field optical cameras as well as on the fast pointing of optical and UV telescope using its moving mirror. The spacecraft “Lomonosov” contains 3 instruments for GRB study: gamma-ray burst monitor BDRG, a wide field optical camera SHOK and UFFO instrument consisting of coding mask X-ray telescope UBAT and UV slewing mirror telescope SMT.
The Lomonosov GRB monitor BDRG is designed to obtain temporal and spectral information about GRBs in energy range 10-3000 keV as well as to produce GRB trigger. The trigger is used onboard to fix some amount of data before GRB stored in the internal memory of all instruments of GRB complex as well as to start the detailed data collection. Immediately after the trigger the onboard estimation of the GRB position starts. Then the telegram with trigger information is sent via Global Star transmitter to the server in MSU and, after automatic ground-based data processing (to exclude radiation belt zones etc.) to GCN (this will be realized sometime later after optimizing the trigger parameters during flight tests).
2. BDRG instrument
BDRG instrument consists of 3 similar detector boxes BDRG-1, BDRG-2 and BDRG-3 connected to data analysis box BA-BDRG. Axes of BDRG detectors are shifted for 90° from each other. Detectors have cosine angular dependence of sensitive area (FWHM ~60o) that allows one to determine the coordinates of GRB with accuracy about several degrees for bright GRBs by the comparison of the detector readings. The sensitivity of the instrument is about 10-7 erg/cm2.
Basic parameters of the BDRG instrument are given in the Table 1.
|
Parameter, units |
Value |
|
Energy range, MeV |
0.01 – 3.0 |
|
Effective area (for three detectors), cm2 |
~360 |
|
Time resolution, ms |
1 (for the burst mode) |
|
Field of view, sr |
2π |
|
Field of effective source location. sr |
π/2 |
|
Sensitivity to the burst detection, erg/cm2 |
~10-7 |
|
Accuracy of burst source location |
~2-4o (for brightest events) |
Each detector consists of optically coupled thin (0.3 cm) NaI(Tl) and considerably thick (1.7 cm) CsI(Tl) crystals (see Fig. 1). The diameters of both scintillators are 13 cm, NaI(Tl) is placed on top of the CsI(Tl) crystal. Working ranges are 0.01-0.5 MeV for NaI(Tl) and 0.05-3 MeV for CsI(Tl). In this way, the NaI(Tl) works as the main detector for hard X-ray timing while the CsI(Tl) is used as an active shield against background gammas, and it can also detect gammas with energy up to few MeV.
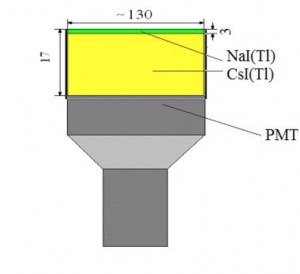
Fig. 1. Design of BDRG scintillation detector
3.BDRG trigger formation
If BDRG monitoring readings demonstrate fast increase of gamma-ray flux the trigger is produced. The trigger is produced independently for each BDRG detector. There are several conditions for trigger production:
Presence of significant fast rise of hard x-rays readings (channel 25-100 keV is used by default in BDRG) Not too high rate in hard X-rays
Additional condition for excluding GRB imitation by electrons based on NaI(Tl)/CsI(Tl) rate ratio in different energy channel
Several time scales are used for independent triggering:
1) 10 ms interval, 1 ms resolution monitoring data and event data added
2) 1 s interval, 10 ms resolution monitoring data and event data added
3) 20 s interval, burst data in event mode added
4. Estimation of GRB coordinates.
GRB coordinates are estimated by comparison of the readings of 3 BDRG detectors having cosine beam of view. The axes of them are shifted at 90o from each other so the GRB direction can be calculated from the formula cos i = Ni/sqrt(N12+N22+N32) where i is the angle between the detector axe and the burst direction and Ni is the number of events in the detector number i. Practically Ni values were estimated for double time interval, for which trigger was elaborated as difference of detected number of gamma-quanta and expected number of background events in given detector before the burst beginning.
Obviously, the burst source position accuracy depends on GRB fluence and background level at the trigger time. Computer simulation showed that the accuracy of GRB localization is up to 2o for bright bursts with fluence 10-5 erg cm-2 measured on the equator and ~5o for GRBs with fluence 10-7 erg cm-2.
5. Structure and amount of BDRG data
Information from BDRG contains a number of data frames formed continuously and a set of different data frames formed for every trigger. Structure and amount of data are presented in the Table 2.
Continuous data contain 3 main types of frames: “monitoring” (count rate in 8 energy channels for NaI(Tl) and CsI(Tl) from each BDRG detector unit), “Spectrum” (724 channel spectra for NaI(Tl) and CsI(Tl) separately) and “Event mode” (primary amplitude values for a fixed number of events combined with time data). The information about the main parameters of all occurred GRB triggers is also transferred continuously in “trigger log” frames.
Trigger data contain the standard set of different data frames, similar to the regular frames: “Monitorong”, “Spectrum” and “Event mode”. There are 3 types of trigger — “fast”, “slow” and “super-slow” — with characteristic time 10 ms, 1 s and 20 s. A sequence of data frames of all 3 mentioned types is formed for “fast” and “slow” triggers and a large “Event mode” data sequence is formed for “super-slow” trigger. A portion of data collected before trigger is included for all trigger types.
Table 2. Structure and amount of BDRG output data
| Type of frame |
Time interval between frames |
Data amount, Mb |
|
Continuous (180 Mb per day) |
||
|
Monitoring |
100ms |
87 |
|
Spectrum |
15s |
48 |
|
Event mode |
15s |
50 |
|
Burst mode for fast/slow burst (5 Mb per burst) |
||
|
Monitoring |
1-10 ms |
1.6 |
|
Spectrum |
1-10 s |
1.6 |
|
Event mode |
Not regular, |
1.6 |
6. Expected number of detected GRBs
To estimate the BDRG detector sensitivity to GRBs we used background counts in the 25-100 keV NaI(Tl) channel ~2*102 s-1 near equator and ~103 s-1 at the polar caps. These values correspond to the minimal fluence S ~10-7 erg/cm2 for typical GRB with optically thin plasma spectrum with kT =100 detected at the equator and S ~510-7 erg/cm2 for the same bursts detected at the Polar caps. It is following from logN – logS distribution that expected number of GRBs detected from the all sky at the sensitivity level S ~10-7 — 10-6 erg/cm2 is about 7102 per year. Taking into account that BDRG FOV is ~2π sr, i.e. half of the sky and that real observational time is about 30% from the total time at the equator and Polar Regions, the expected number of GRBs, which could be detected by any of three BDRG units, is ~102 per year. The overlap area of the all three detectors, in which GRB location with sufficiently good accuracy (3-5o) is possible, is 1⁄4 of BDRG FOV. It means that expected number of good located events is about 25 per year.
7. SGRs and GRBs detected by BDRG instrument
List of seven events, detected by BDRG / “Lomonosov” is presented in Table 3.
Table 3.
|
The event number |
1 |
2 |
3 |
4 |
5 |
6 |
7 |
||
|
Type |
SGR |
SGR |
SGR |
SGR |
SGR |
GRB |
GRB |
||
|
Date |
18.6.2016 |
20.6.2016 |
23.6.2016 |
23.6.2016 |
26.6.2016 |
03.7.2016 |
05.7.2016 |
||
|
Time Start |
20:27:24 |
15:16:34 |
21:20:45 |
21:23:35 |
13:54:29 |
12:10:02 |
17:40:19 |
||
|
Time End |
20:27:24 |
15:16:34 |
21:20:45 |
21:23:35 |
13:54:30 |
12:10:50 |
17:40:21 |
||
|
Total duration, s (T90, s) |
0.1 |
0.207 (0.167) |
0.5 |
0.1 |
0.8 |
42.8 (34.2) |
3.4 (2.6) |
||
|
Time resolution available, s |
0.1 |
0.001 |
0.1 |
0.1 |
0.1 |
0.1 |
0.1 |
||
|
minimal channel, keV |
10-20 |
10-20 |
10-20 |
10-20 |
10-20 |
10-20 |
35-60 |
||
|
maximal channel, keV |
60-100 |
100-170 |
60-100 |
60-100 |
100-170 |
170-300 |
170-300 |
||
|
Best illuminated BDRG box |
BDRG2 |
BDRG1 |
BDRG2 |
BDRG2 |
BDRG1 |
BDRG2 |
BDRG3 |
||
|
Count rate /0.1s 20-35keV |
287 |
451 |
274 |
236 |
378 |
10 |
17 |
||
|
Count rate /0.1s 35-60 reV |
156 |
238 |
156 |
94 |
227 |
12 |
15 |
||
|
count rate /0.1s 60-100 keV |
34.0 |
67.1 |
49.6 |
35.7 |
66.3 |
13 |
18 |
||
|
count rate /0.1s 100-170 keV |
0.00 |
4.99 |
3.06 |
0.97 |
3.98 |
9 |
12 |
||
|
(20-35)/(60-100) in peak |
8.44 |
6.72 |
5.51 |
6.62 |
5.70 |
0.77 |
0.94 |
||
|
(20-35)/(60-100) for total |
8.44 |
7.03 |
7.81 |
6.62 |
5.68 |
0.95 |
0.32 |
||
|
Fluence in 20-170 keV range, erg/cm2 |
3.0E-07 |
9.5E-07 |
1.5E-06 |
2.3E-07 |
3.3E-06 |
5.9E-06 |
5.4E-07 |
||
Light curves for all events, obtained in several energy channels by the best-illuminated BDRG boxes are shown on Figures 2-8. The monitoring data with time resolution 0.1s were used.
The events No 1-5 in the Table 3 are SGR outbursts from the same magnetar SGR 1935+2154 (see information from other missions in GCN circulars #19546, #19613 and #19665). Two outbursts on June 23, 2016, UT ~21:20:46 and ~21:23:36 were observed also in the CALET experiment (see http://cgbm.calet.jp/cgbm_trigger/flight//1150752000/index.html), the second one was also detected by Fermi (http://gcn.gsfc.nasa.gov/other/488409820.fermi).
For one SGR event (June 20, 2016 at 15:16:34) we have detailed data obtained in a trigger mode which allowed analyze light curve of this SGR with millisecond time resolution. The light curve for this outburst with the time resolution 1 ms over the whole energy range of BDRG is shown on Fig.9. Light curves with 10ms resolution for three energy channels (NaI(Tl) with energy releases 20-40, 40-70 and >70 keV) are shown on Fig.10. One can see from Fig.10 that during the burst its spectrum becomes softer.
The SGR outburst 26.06.2016 at ~13:54:29 has duration ~800-900 ms — much longer than of previous ones. According to monitoring data the spectral shape did not change significantly during this outburst.
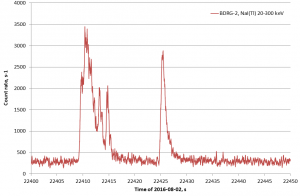
Besides SGR outbursts, gamma-ray emission from three GRBs was detected at the significant level (events 6-7 in Table 3 and GRB20160720 being under analysis, see light curve at fig.11). The GRB 160703A was also seen in several experiments including KONUS-Wind and Swift (see GCN circulars http://gcn.gsfc.nasa.gov/other/160703A.gcn3). BDRG detected the gamma-ray emission during ~42.8 s. The burst’s light curve has multi-pulse shape. The GRB on July, 5, 2016 was also seen by KONUS-Wind, the light curve is available at http://gcn.gsfc.nasa.gov/notices_k/GRB20160705_63619.341_k.jpeg. BDRG detected gamma-ray emission during ~3.4 s.
It is necessary to state that all time scales in the figures are instrumental, it may differ from UTC up to few seconds, though in reality the difference seems to be not so large. The better time calibration will be made sometime later.
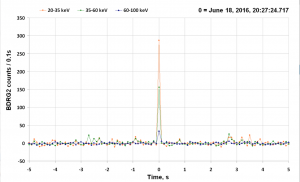
Fig.2. Light curve of a SGR occurred on June 18, 2016 at 20:27:24.
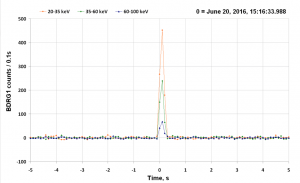
Fig.3. Light curve of a SGR occurred on June 20, 2016 at 15:16:34.
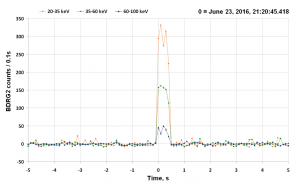
Fig.4. Light curve of a SGR occurred on June 23, 2016 at 21:20:45.
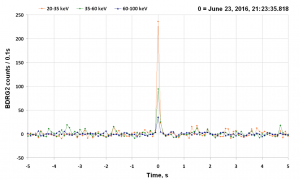
Fig.5. Light curve of a SGR occurred on June 23, 2016 at 21:23:36.
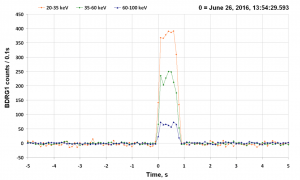
Fig.6. Light curve of a SGR occurred on June 26, 2016 at 13:54:29.
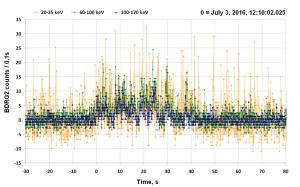
Fig.7. Light curve of a GRB occurred on July 3, 2016 at 12:10.
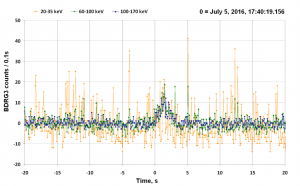
Fig.8. Light curve of a GRB occurred on July 5, 2016 at 17:40:20.
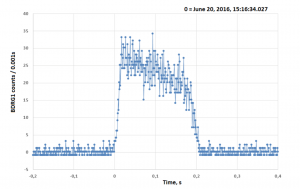
Fig.9. Light curve of a SGR occurred on June 20, 2016 at 15:16:34. BDRG1/Lomonosov data in all energy range with time resolution 1ms are plotted.
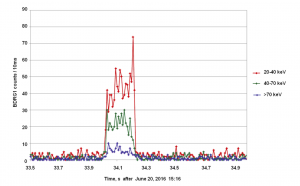
Fig.10. Light curves of a SGR occurred on June 20, 2016 at 15:16:34 obtained by BDRG1/Lomonosov. Numbers of events in NaI(Tl) in the energy ranges 20-40 keV (red), 40-70 keV (green) and >70 keV (blue) are shown. The time resolution is 10ms.
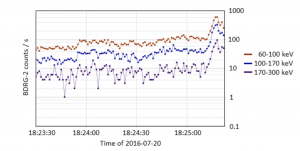
Fig.11. Light curve of a GRB occurred on July 20, 2016 at 18:23:57.